The phonopy code can calculate
a range of harmonic and quasi-harmonic vibrational properties and from
version 2.0 onwards supports DFTB+. Information about how to install
phonopy is available, it is also
available on conda-forge:
mambainstall-cconda-forgephonopy
The below examples were tested with phonopy v2.14.0.
The diamond lattice has very high symmetry, hence a phonon band structure can be
obtained with a single calculation. A conventional unit cell with relaxed
lattice constant is provided in geo.gen (the phonopy input assumes this is the
name of the supplied starting geometry).
The DFTB+ input needs to calculate the atomic forces and also to write a results
tag file, hence the dftb_in.hsd input contains lines including:
Analysis={# required option for phonopyCalculateForces=Yes}Options={# Required options for storing data needed by phonopyWriteResultsTag=Yes}
The (single) distorted geometry and the required phonopy_disp.yaml file is then
generated with the command
phonopy-d--dim="4 4 4"--dftb+
This constructs a 4x4x4 supercell of the primitive cell and saves the
undistorted and distorted supercells as geo.genS and geo.genS-001
respectively. Note that you should test the phonon band structure is
converged with respect to the number of repeats used in making the
supercell (and likewise for any other properties of interest), as well
as the number of k-points used in the DFTB+ calculation.
For the single (in this case) generated geo.genS-* file, calculate
the forces on the atoms, using DFTB+ and retaining the resulting
results.tag file
dftb+
Then create the required FORCE_SETS file
phonopy-fresults.tag--dftb+
This assumes that the results.tag and phonopy_disp.yaml files are
in the same directory (for more complex cases this stage of the
phonopy calculation should be run in the same directory as
phonopy_disp.yaml file and paths given to directories containing the
DFTB+ output results.tag files).
Then specify the path in the Brillouin zone you are interested in in
band.conf (see the phonopy documentation),
and post-process the phonopy data, again providing the dimensions of
the the supercell repeat. This can either be on the command line or in
the settings file (a DIM file):
phonopy-pband.conf--dim="4 4 4"--dftb+
Finally, you can save the band structure data in gnuplot format
phonopy-bandplot--gnuplotband.yaml>band.dat
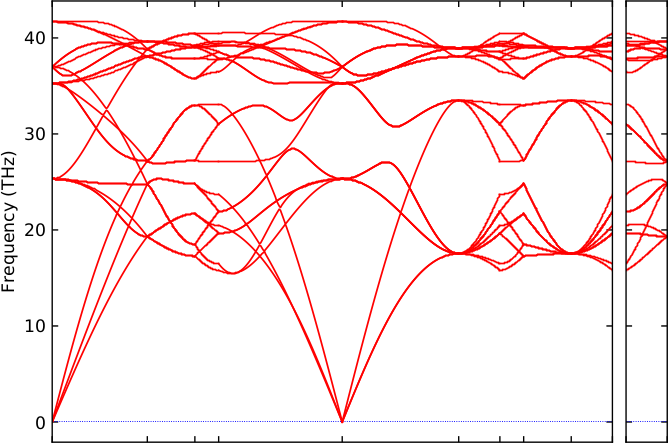
The resulting band structure for the mio carbon model is shown in
Figure 24.
For lower symmetry geometries, multiple geo.genS-* files will be
generated.
Assuming the dftb_in.hsd file expects the geometry to be called
geo.gen and knows an absolute path to the Slater-Koster data, a simple
bash shell loop to run these calculations could look like
for struct in geo.genS-*
do
  export dir=$(echo $struct | sed 's/geo.genS-//g')
  echo "Processing $dir"
  mkdir $dir
  cp $struct $dir/geo.genS-001
  cp dftb_in.hsd $dir
  cd $dir
  dftb+
  cd ..
done
In practice, the separate DFTB+ calculations could be submitted to a
queueing system.
As separate calculation outputs are then in sub-directories, phonopy
processing of the multiple results.tag files would be done with