Absorption spectrum of a macromolecule#
[Input: recipes/linresp/macromolecule/]
In this recipe, we increase significantly the dimension of our system, and hence of our eigenvalue problem. The structure in question is \(C_{66}O_{10}N_{4}H_{44}\). This is a more realistic target system for a TD-DFTB calculation. Our goal is to compute the absorption spectrum of this molecule up to energies of approximately 1 Hartree. To cover this energy range, we will need to obtain the first 20 singlet excitation energies and oscillator strengths. This is computed as usual:
ExcitedState {
    Casida {
        NrOfExcitations = 20
        Symmetry = singlet
        Diagonaliser = Arpack{}
    }
}
After obtaining the energy and oscillator strength pairs (takes very few minutes), we can use a simple script to plot the absorption spectrum. The script (spectrum.py) is provided in the input folder and requires Python 3. Simply run:
python spectrum.py > abs.dat
and plot the content of abs.dat with your graphing tool of preference. The script employs a Lorentzian function for the spectral broadening, with a full width at half-maximum parameter of \(\Gamma\) = 0.2 eV. Specifically, what is plotted is the molar extinction coefficient, defined as
The sum runs over all computed excitations \(I\), with energy \(\omega_I\) and oscillator strength \(f_I\). The factor \(C\) = 3.5 × \(10^{-5}\) M cm/eV.
Windowing#
For the study of excitations with low-to-medium collective character, as in our example, it is possible to reduce considerably the dimension of the response matrix by disregarding Kohn-Sham (KS) transitions with small coupling to the excitations in question. This can be achieved in practice by systematically discarding those orbital pairs \(\phi_{p\sigma}\) and \(\phi_{q\sigma}\) with energy differences \(\epsilon_{p\sigma} - \epsilon_{q\sigma}\) far away from the excitation energies of interest. In DFTB+, this is done by defining an energy windows that sets a threshold for all KS transitions entering the Casida equation. For the computation of excitation energies, energy windows can often be set to be fairly small, without losing accuracy. On the other hand, for the study of absorption spectra, energy windows need to be defined larger, as oscillator strengths are much more sensitive to even small values of the off-diagonal elements of the response matrix. However, DFTB+ offers the possibility to select transitions based on both energy and oscillator strength values. Thus, additionally to the energy window, it is possible to define an oscillator strength cutoff in the calculations. Our experience tells us that with the combination of both truncations, the dimension of the response matrix can be reduced significantly more than with the use of only the energetic constraint, for a given accuracy.
For our macromolecule, we will set an energy cutoff of 0.1 Hartree
beyond the energy region of interest (defined by the first 20
single-particle transitions and roughly equal to 1 Hartree). As for
the oscillator strength window, we will use a cutoff of
\(10^{-3}\). These values ensure a negligible loss of accuracy in
the optical spectra, while reducing the computation time by roughly
half. Those are specified in the Casida block using the
EnergyWindow and OscillatorWindow keywords:
ExcitedState {
    Casida {
        NrOfExcitations = 20
        Symmetry = singlet
        EnergyWindow = 0.1
        OscillatorWindow = 0.001
        Diagonaliser = Arpack{}
    }
}
The resulting spectra with and without truncation of the KS transitions can be observed in the following figure:
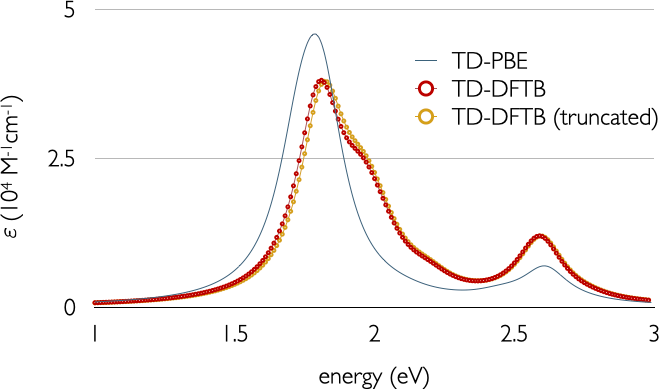
We have also provided TD-DFT results using the PBE functional and a triple-Z plus polarisation basis set for comparison. To put this into perspective, we needed roughly five days to obtain the PBE spectra under the same computational conditions.