MD simulations contain various information about the system. Fluctuations and
correlations in the ground state encode information about excitations
(fluctuation-dissipation theorem) and transport (Einstein relation and also the
Green-Kubo relations).
Autocorrelation, where data is compared against its self at different
time offsets along the sequence
RXX(t1, t2) = E[X(t1), X(t2)]
(where E is an expectation, typically a dot product) and gives a
measure of the time dependent correlation. The Fourier transform of
the time dependent autocorrelation then gives the frequencies at which
there is repetitive (oscillatory) behaviour.
The atomic velocity-velocity auto-correlation encodes the (anharmonic)
vibrational modes, while a dipole moment auto-correlation contains
information on the intensities of the modes (a vibration where there
is no change of dipole moment will appear in the velocity
autocorrelation, but not the dipole autocorrelation).
A simple script (velo_autocorr) is provided with these recipes to
calculate velocity-velocity autocorrelation and the resulting
frequencies.
The example used in Dynamics in the ground state is a suitable source of a
trajectory. Run this to get the xyz trajectory as geo_end.xyz,
noting the number of MD steps and the time step. The script options
are printed by velo_autocorr -h, and assuming you have 20000 MD
steps and the time step is 0.5 fs:
The 10000 value is telling the code to use this number of MD steps to
evaluate the autocorrelation, but as there are 20000 steps, it
calculates multiple windows of this size and averages to reduce noise.
This produces two files molec.vv.dat (the autocorreation) and
molec.spectrum.dat (it’s Fourrier transform, i.e., vibrational
frequencies). The spectrum data is in frequency inits of wavenumbers
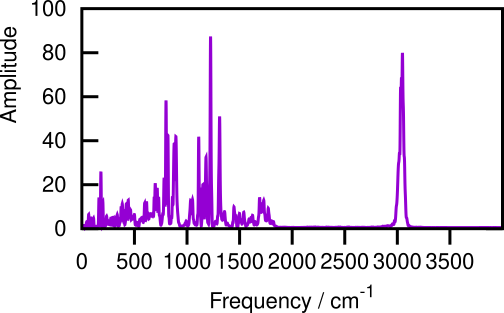
(cm-1), and the interesting part is below 4000 cm-1.
Figure 5 Anharmonic spectra from velocity autocorrelation (excluding large
peak at ~0 cm-1.#
Try different sizes of the window and see what happens to the spectra.
You can also compare these modes with the frequencies of the
quasi-harmonic modes of Vibrational modes.