Absorption spectrum of NO-TiO2 complex#
[Input: recipes/linresp/no-tio2/]
Our previous example shows how TD-DFTB can tackle large molecules at a fraction of the computational cost needed by more sophisticated methods. However, a first-principle calculation of this complexity presents only a very minor challenge for today’s average supercomputers. In this recipe, we raise again the bar and show how a problem that is unfeasible to practically solve at the DFT level of theory, can be easily addressed using DFTB+ on a modern personal computer.
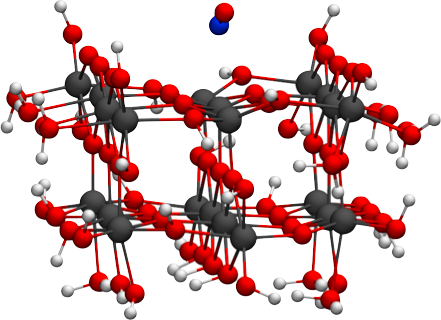
The system in question is a NO molecule adsorbed on the rutile (110) titania surface. We employ a cluster model as shown in the next figure:
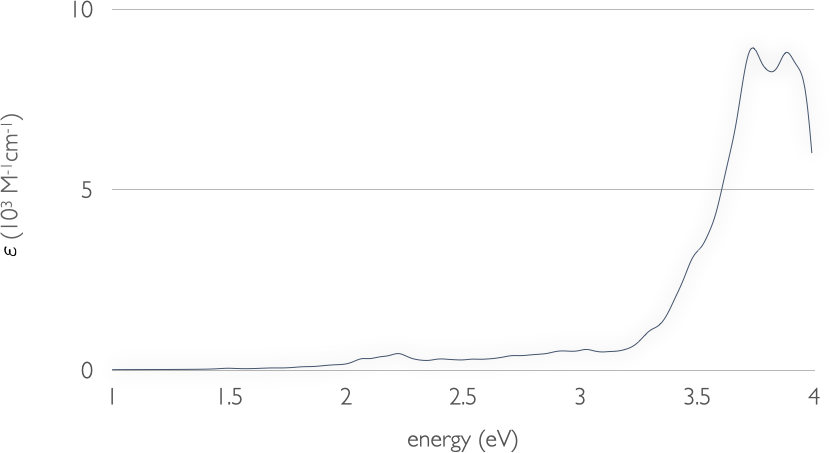
We would like to compute the absorption spectrum of this complex up to
the UV-A region, so that we can observe both near band-gap excitations
of TiO2 and ligand-to-substrate charge-transfer (CT)
transitions in the visible range. The challenge here is in the high
number of excitations that need to be solved to cover the desired
energy region. Specifically, we have to set NrOfExcitations to 1200
to cover a region of up to 4 eV:
ExcitedState {
    Casida {
        NrOfExcitations = 1200
        EnergyWindow = 0.01
        Diagonaliser = Arpack{}
    }
}
we have set EnergyWindow = 0.01 to save computational time. We can
choose such a small energy cutoff as titania band-to-band transitions
have a rather low collective character. The visible range of the
spectrum, which is of most interest, is negligibly affected by this
truncation, as the CT absorption bands are away from the energy window
frontier. This constraint speeds up the calculation roughly 7 times!
After obtaining the EXC.DAT output file (we provide it in the recipe folder as the calculation will take some time to complete), we can run the spectrum.py script to obtain the absorption spectrum. Only those transition with a spin contamination smaller than 0.5 will be considered. This value is hard-coded in spectrum.py, and the reader can modify it at his/her convenience. The absorption spectrum should finally look like this: